What I Built
A tool that helps quickly understand how competitors position themselves in the market. Instead of spending hours manually reading through competitor websites and taking notes, this tool does the heavy lifting automatically. Even if you would use AI to do the analysis, this tool will have all the prompts ready built in and you can get forward with just a few clicks and the all the data will be saved to database for future use.
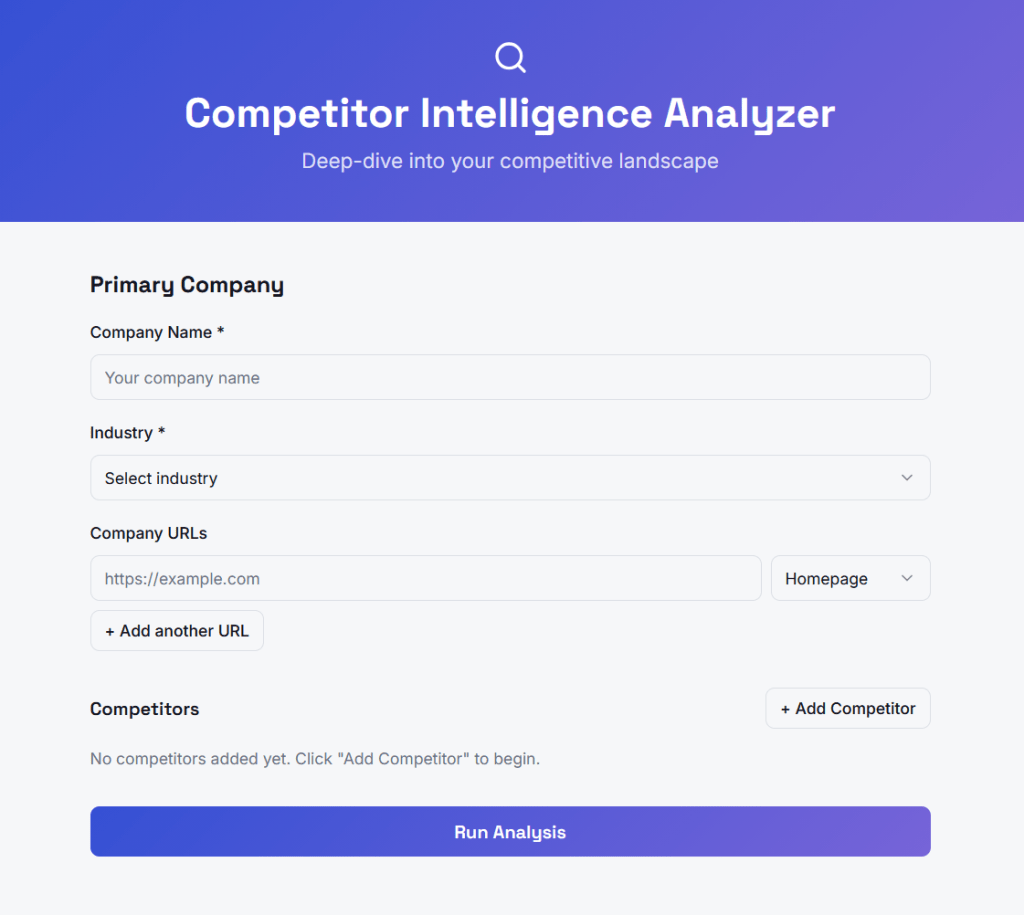
Here’s how it works: You enter a company name and up to four competitors, add their website URLs (homepage, pricing page, about page), and the system fetches all that content, reads it with AI, and delivers a structured analysis of each company’s messaging and positioning.
The output tells you:
- Who each company is targeting (their ideal customer)
- Their core value proposition
- Their tone of voice
- What they claim makes them different
- How they try to convert visitors (free trial, demo, contact sales)
This is a first version focused on one thing: messaging and positioning analysis. I’m intentionally keeping the scope tight so I can ship something useful fast. Later versions could add more data sources like job postings (to see where competitors are investing), ad campaigns, customer reviews, and social media presence.
This is how the tool looks like:
Why This Tool Exists
If you work in B2B marketing — whether at an agency or in-house — you’ve probably done competitor analysis manually. You open five browser tabs, read through websites, copy-paste quotes into a doc, and try to spot patterns. It works, but it’s slow and inconsistent.
This tool doesn’t replace strategic thinking. It handles the tedious data collection and extraction so you can focus on the insights and recommendations.
There’s another benefit I thought could be handy and was good to decide before starting: every analysis gets stored in a database. Over time, this becomes valuable on its own. Run fifty analyses across different industries and you start seeing patterns — which messaging approaches are common in HR tech versus fintech, what positioning white space exists in a crowded market, how companies in a category talk about similar problems differently.
The Technical Approach (Explained Simply)
We’re using four tools that work together:
Airtable — A database that’s easy to use and doesn’t require coding. It stores all the analysis data in structured tables. We chose Airtable because it’s visual, has a generous free tier, and connects easily to automation tools.
Make.com — An automation platform that connects everything together. When someone submits an analysis request, Make handles the entire workflow: creating database records, fetching webpages, sending content to AI, and storing the results. Think of it as the central nervous system.
OpenAI — The AI that reads webpage content and extracts the messaging signals. We’re using GPT-4o-mini because it’s fast, affordable, and smart enough for this task. We don’t need the most powerful model — we need one that reliably follows instructions.
Lovable — A tool for building web interfaces without coding. This will be the front-end where users actually interact with the tool. We haven’t built this part yet.
I was already familiar with the tools but the how the data flowed was again different and gave lot’s of new learnings.
How The Data Flows
The system has three connected database tables:
- Analyses — The master record for each analysis run. Stores the primary company name, industry, date, and eventually the cross-competitor summary.
- Companies — One record per company in an analysis. So each analysis has five company records (one primary, four competitors). Stores the AI-generated positioning profile for each.
- Pages — One record per URL. Each company can have multiple pages (homepage, pricing, about). Stores the extracted messaging from each page.
This structure matters because it keeps everything organized and queryable. Want to see all analyses in the SaaS industry? Easy. Want to compare how ten different companies talk about pricing? The data structure supports it.
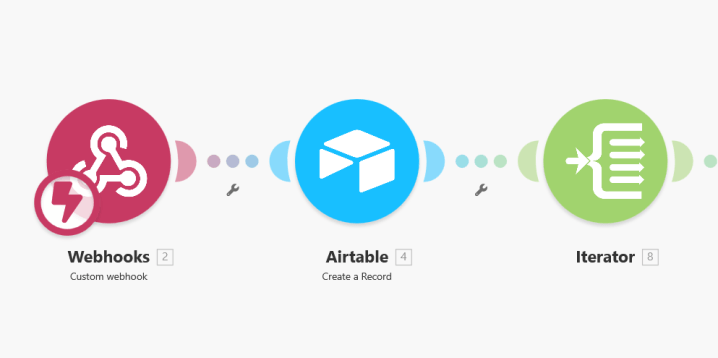
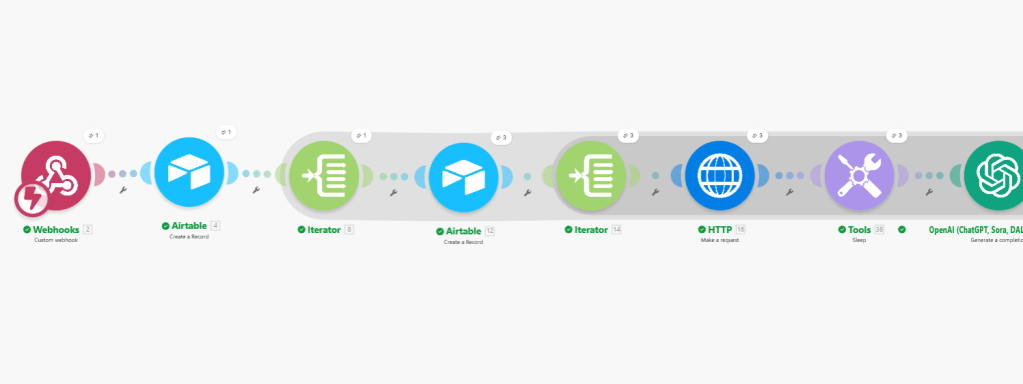
The Automation Workflow
Here’s what happens when someone submits an analysis request:
- Webhook receives the data — The user interface sends all the input (company names, URLs, industry) to Make.
- Create the Analysis record — Make creates a new record in the Analyses table with status “Pending.”
- Loop through each company — Make processes each of the five companies one by one.
- Create Company records — For each company, Make creates a record in the Companies table, linked back to the Analysis.
- Loop through each page — For each company, Make processes each URL they submitted.
- Fetch the webpage — Make grabs the raw HTML content from each URL.
- AI extracts the messaging — OpenAI reads the messy HTML and pulls out just the relevant messaging signals, ignoring navigation menus, footers, and cookie banners.
- Store the results — The extracted messaging gets saved in the Pages table.
- Aggregate page insights — Once all pages for a company are processed, Make collects them and sends them to OpenAI for a unified company positioning summary.
- Store company summary — The positioning summary gets saved back to the Companies table.
- Generate cross-competitor analysis — After all companies are processed, Make sends all positioning summaries to OpenAI for a final strategic comparison.
- Complete the analysis — The cross-competitor summary gets saved to the Analyses table and status updates to “Complete.”
- Display results — Lovable polls Airtable, detects the completed status, and displays the results to the user.
Why I Made Certain Choices
Starting with messaging and positioning only — This is the highest-value output for a marketer and requires only one data source (the website). No complex scraping, no fragile API connections. Clean and reliable.
Letting users submit URLs instead of auto-fetching — I considered having the system automatically find all relevant pages for a company, but that adds complexity and potential points of failure. Having users paste specific URLs is simpler, more reliable, and actually more accurate — they know which pages matter.
Using GPT-4o-mini instead of GPT-4 — For structured extraction tasks like this, the smaller model performs nearly as well at a fraction of the cost. Save the powerful models for tasks that actually need them.
Storing raw AI output in the database — Even if I change how to display results later, the underlying data is preserved. This also enables the aggregate insights layer we want to build eventually.
What’s Next
- Test with more companies to validate output quality
- Add more page types (pricing, about)
- Explore adding external data sources (ads, reviews, hiring signals). Allthough I’m getting notifications from my tools that I’m hitting my datalimits soon so my free tier exploration might end soon 🥲
~~~
💡Additional thoughts and comments:
I switched to Claude and using Opus 4.5 to to help me along the way (I heard that Opus is better for this type of technical tasks). I have to say it works better than ChatGPT. I added some instructions to the project and it does follow them quite nicely. Also this article that I asked it to do is way better in language and structure than the one I made with ChatGPT. I don’t think my asks for Claude are that good but it just gets me 🤓
I can feel the learning curve is so steep. Especially in the first bigger project I made. Now I already feel so much more confident and faster with the tools. After a few more I’m a total pro already! 😉 I’m enjoying and this gets me into flow for hours (if I just have uninterrupted time).
